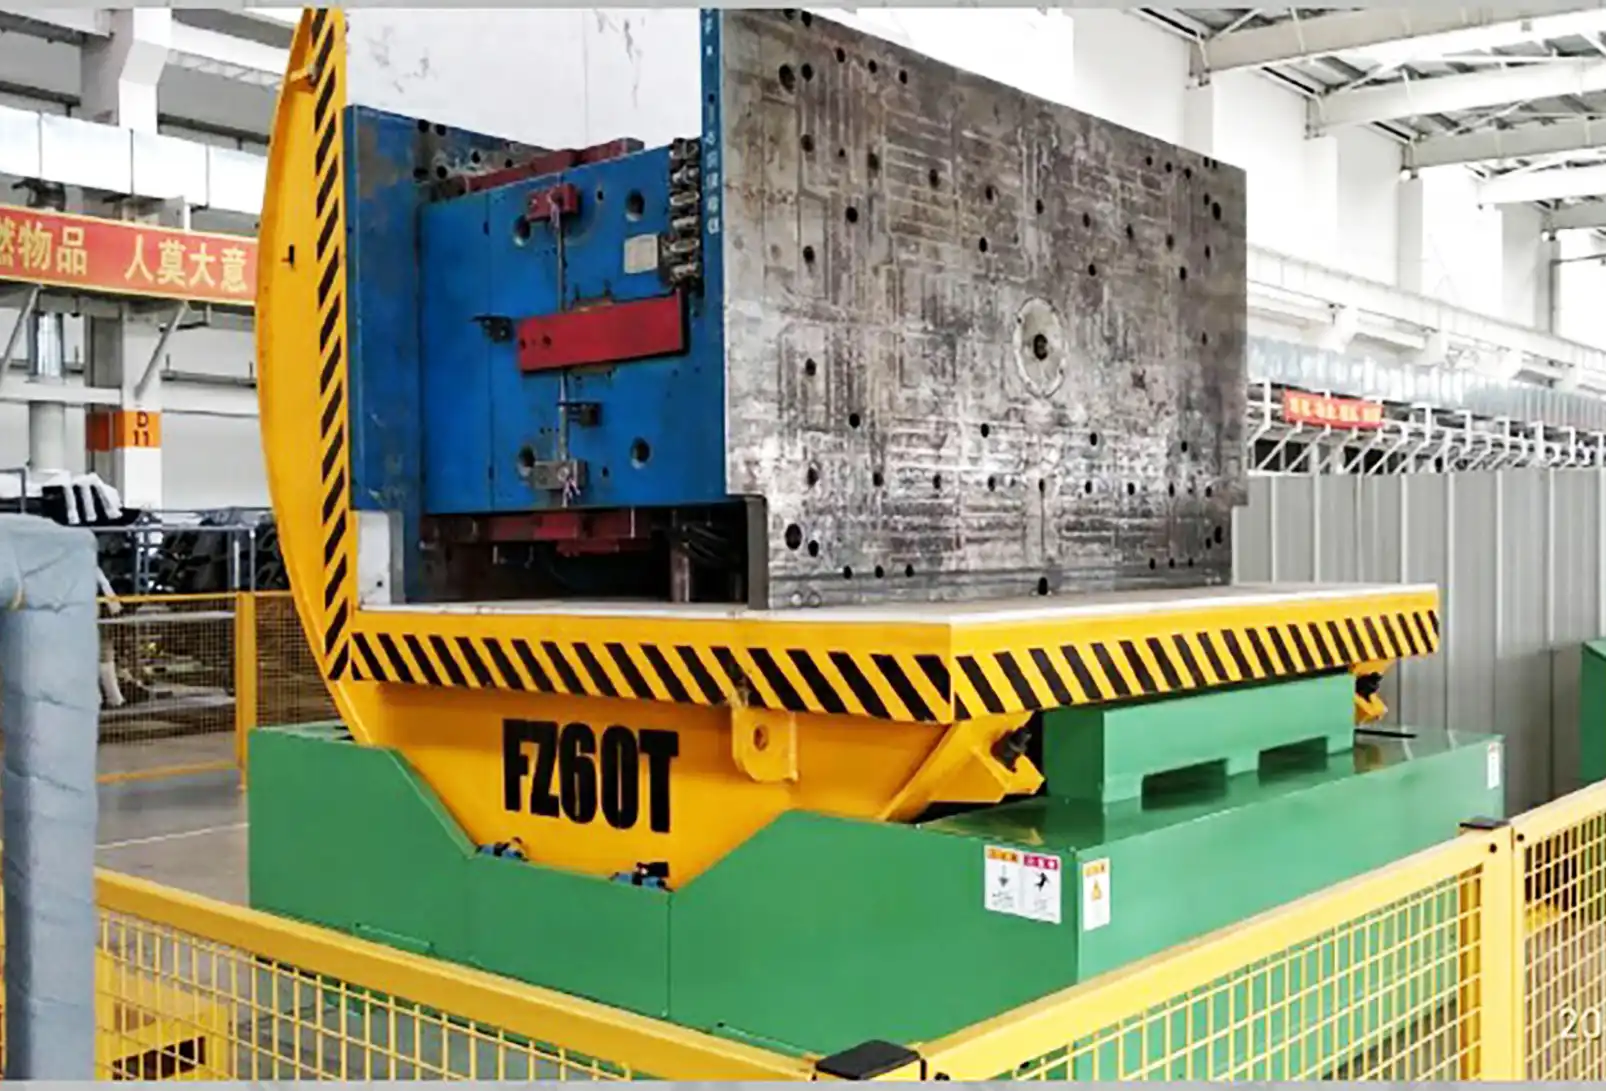
How Do U.S. Engineers Evaluate the Efficiency of Mold Tilting Systems?
Your factory floor is a complex ecosystem. Every piece of equipment must work perfectly to maintain productivity. But what about that mold tilting system in the corner? You know it's crucial, but you suspect it might be an energy hog or a bottleneck. An inefficient tilter slowly drains your profits through wasted energy, slow cycle times, and potential safety hazards. Making the wrong call on whether to repair or replace it can lead to a costly investment mistake, setting you back months or even years. I've seen this happen. But over my years working with top U.S. engineering teams, I've learned they use a specific, data-driven framework to make these decisions with confidence. This is the framework I want to share with you today.
U.S. engineers evaluate the efficiency of a mold tilting system by methodically analyzing four core areas: cycle time performance, energy consumption per cycle, safety and ergonomic compliance, and long-term maintenance costs. They quantify these factors using key performance indicators (KPIs) like seconds per cycle, kWh per tilt, OSHA compliance scores, and Mean Time Between Failures (MTBF) to create a total picture of the system's operational and financial efficiency.
This data-first approach removes guesswork and emotion from the decision. It transforms a vague feeling of "this machine is old" into a clear, actionable business case. It's the difference between spending money and investing it wisely. But knowing what to measure is only the first step. The real value comes from understanding how to measure it and what the numbers truly mean for your bottom line. So, let’s break down each part of the evaluation process, just as a pragmatic U.S. engineer would.
What Key Performance Indicators (KPIs) Matter Most in Cycle Time Analysis?
You know that a faster cycle time means higher throughput. But simply timing the machine from start to finish with a stopwatch doesn't give you the full story. This single number can hide significant inefficiencies within specific movements of the machine. You might blame the hydraulics for being slow when the real problem lies in the clamping mechanism or the control system's response time. Without pinpointing the exact bottleneck, any attempt to improve performance is just a shot in the dark. The best engineers I’ve worked with in the U.S. don’t just look at the total time; they break the cycle down into granular KPIs to find exactly where time is being lost.
The most critical KPIs for a mold tilting system's cycle time analysis are the individual timings for each phase of the operation. This includes the clamp activation time, the tilt-up duration, the tilt-down duration, and the unclamp time. By isolating and measuring these specific phases, engineers can identify the exact mechanical, hydraulic, or control system components causing delays.
Deconstructing the Cycle for Deeper Insights
To truly understand efficiency, you must look at the system as a sequence of events, not a single action. Each part of the sequence presents an opportunity for optimization. U.S. engineers often use data loggers connected to the machine's PLC or even high-speed cameras to get precise measurements for each step. This level of detail is where you find the real opportunities.
The Phases of a Tilting Cycle
The total cycle time is the sum of its parts. A typical breakdown includes:
- Loading/Positioning Time: How long it takes for the mold to be correctly placed on the tilter. While often manual, the tilter's design can make this easier or harder.
- Clamping Time: The time from when the "clamp" command is given to when the mold is fully secured. This tests the speed of the hydraulic or pneumatic actuators.
- Tilt-Up Time: The duration of the primary tilting motion from horizontal to vertical (or the specified angle). This is a direct measure of the power and efficiency of the main drive system.
- Dwell Time: Any programmed pause at the peak of the tilt.
- Tilt-Down Time: The duration of the return motion.
- Unclamping Time: The time it takes to release the mold.
- Unloading Time: The time required to remove the mold from the system.
I remember a client in Ohio who was convinced their entire tilting system needed a hydraulic overhaul because it was "too slow." By breaking down the cycle, we discovered the tilt-up and tilt-down times were actually within the manufacturer's specifications. The real bottleneck was a 15-second delay during clamping. The cause? A faulty pressure switch in the hydraulic clamp circuit. A simple, inexpensive sensor replacement saved them from a $50,000 hydraulic system upgrade they didn't need.
Analyzing the Data
Once you have the data, you can compare it against benchmarks. These benchmarks can come from the Original Equipment Manufacturer (OEM) specifications, data from newer models, or even theoretical minimums based on the physics of the system.
| KPI | Old System (Measured) | New System (Benchmark) | Potential Time Saving |
|---|---|---|---|
| Clamping Time | 15 seconds | 5 seconds | 10 seconds |
| Tilt-Up Time | 25 seconds | 20 seconds | 5 seconds |
| Tilt-Down Time | 22 seconds | 18 seconds | 4 seconds |
| Unclamping Time | 12 seconds | 4 seconds | 8 seconds |
| Total Cycle Time | 74 seconds | 47 seconds | 27 seconds |
This kind of table makes the problem clear. It shows exactly where the inefficiencies lie and quantifies the potential gains from an upgrade. This is the language that justifies investment.
How is Energy Consumption Accurately Measured and Benchmarked?
Your monthly energy bill arrives, and it's higher than you'd like. You look at the massive hydraulic power unit on your old mold tilter and assume it's one of the main culprits. But an assumption isn't data. Without precise measurements, you can't prove that the tilter is the energy hog you think it is. You might spend a significant amount of capital on a new system only to find your energy bills barely change because the real problem was an old air compressor or inefficient lighting. To make a financially sound decision, U.S. engineers insist on getting hard numbers. They isolate the machine and measure its exact energy use, providing the proof needed to act.
To accurately measure a mold tilting system's energy consumption, U.S. engineers install a dedicated power quality analyzer or kilowatt-hour (kWh) meter directly on the electrical supply to the machine. They measure the energy used per cycle and during idle periods. This data is then benchmarked against the manufacturer's original specifications, data from modern energy-efficient systems (like those with VFDs), or industry standards to quantify waste.
Pinpointing Energy Waste with Precision
The key to a useful energy audit is isolation. You cannot rely on your main plant meter to tell you what a single machine is doing. The process is straightforward but requires the right tools.
The Right Tools and Metrics
Engineers will use a portable power analyzer that clamps onto the power lines feeding the tilter's motor and control panel. This tool measures several key things:
- Idle Power Consumption: How much energy the machine uses when it's on but not moving. For older hydraulic systems, this can be surprisingly high, as the pump motor may run continuously to maintain pressure.
- Peak Power Draw: The maximum power drawn during the most strenuous part of the cycle, usually the initial tilt-up motion.
- Total kWh per Cycle: The total amount of energy consumed to complete one full tilting operation. This is the most important metric for calculating operational cost.
I worked with a steel processor in Mexico, a man much like Javier, who was focused on reducing his plant's high energy costs. We audited his packaging line, including an old mold tilter. The data was eye-opening. The tilter's hydraulic pump ran constantly, consuming 4 kW even when idle, which was about 80% of the day. The actual tilting motion only required a peak of 15 kW for about 45 seconds per cycle. The majority of its energy cost came from just sitting there.
Benchmarking for a Clear Business Case
Once you have the data, you can build a financial case. A modern electromechanical tilter or a hydraulic system equipped with a Variable Frequency Drive (VFD) uses almost no power when idle. A VFD allows the motor to run only as fast as needed, drastically cutting consumption.
| Parameter | Old Hydraulic System | Modern System with VFD | Financial Impact (Annual) |
|---|---|---|---|
| Idle Power Consumption | 4.0 kW | 0.2 kW | Savings of 3.8 kW |
| Energy per Cycle (kWh) | 0.5 kWh | 0.3 kWh | 40% reduction per cycle |
| Annual Energy Cost | $5,256 | $876 | $4,380 Savings |
(Assuming 16 hours/day operation, 250 days/year, $0.15/kWh)
This table doesn't just present technical data; it translates that data into dollars. For a CEO or plant owner like Javier, seeing a potential annual saving of over $4,000 on a single machine makes the decision to upgrade much simpler. This is how U.S. engineers build an undeniable case for investing in efficiency.
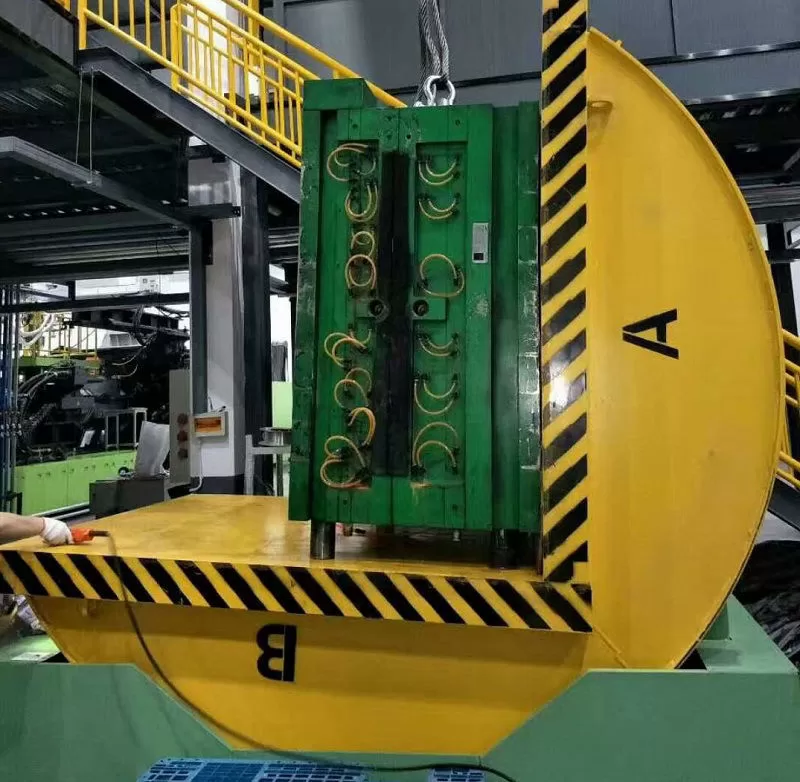
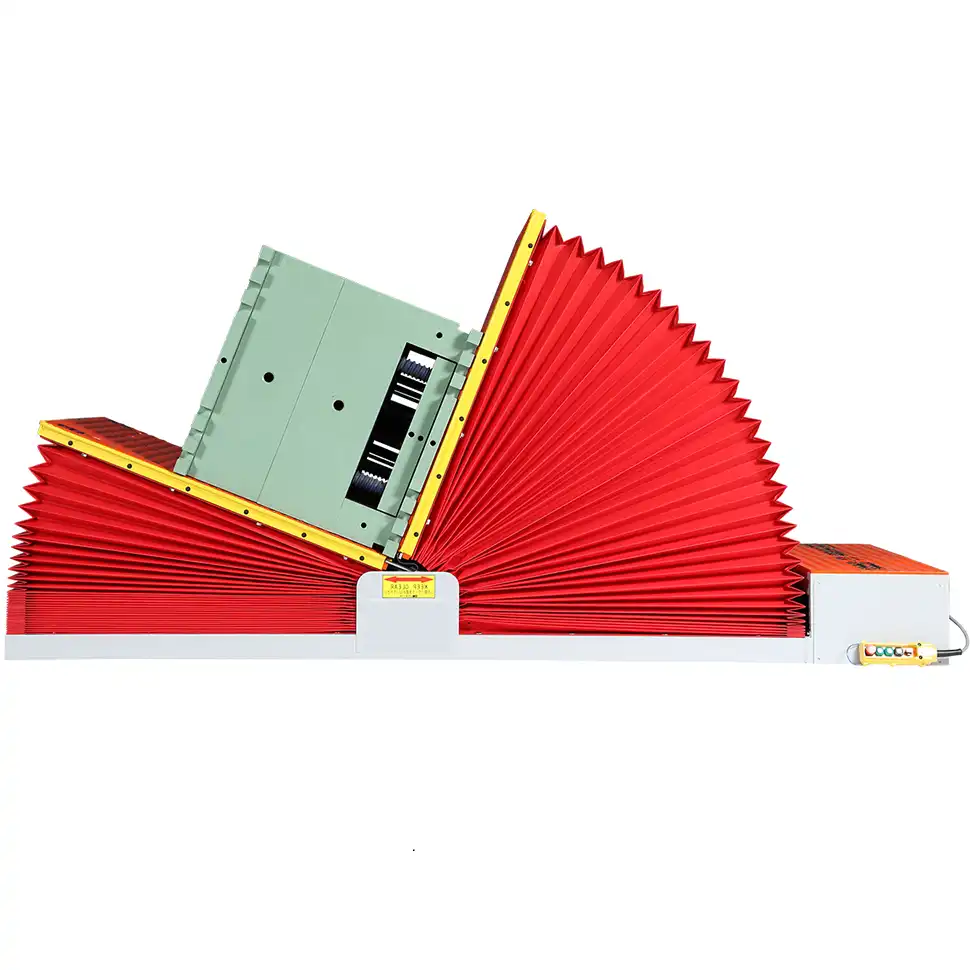
What Does a Thorough Safety and Ergonomics Audit Involve?
Your mold tilting system has been operating for years without a major incident. It's easy to become complacent and assume that "if it isn't broken, don't fix it." But in the world of heavy industrial equipment, a lack of accidents in the past is not a guarantee of safety in the future. A single failure of a hydraulic hose or a worn-out mechanical lock can have catastrophic consequences. U.S. safety standards, particularly from OSHA, are rigorous for a reason. Pragmatic engineers know that a proactive safety audit isn't about bureaucracy; it's about protecting their people and their business from devastating risk.
A thorough safety and ergonomics audit of a mold tilting system involves a systematic evaluation against established standards like OSHA 1910. This includes inspecting physical guards, verifying the function of emergency stop circuits and light curtains, checking the integrity of hydraulic and mechanical components, and assessing operator ergonomics. The findings are often documented in a risk assessment matrix to prioritize corrective actions.

A Systematic Approach to Risk Mitigation
A proper safety audit is a formal process, not a casual walkthrough. It's a structured inspection that leaves no stone unturned. Engineers use detailed checklists to ensure every potential hazard is considered.
Key Areas of a Safety Audit
- Machine Guarding: Are all pinch points, gears, and moving parts properly guarded to prevent contact? Are the guards fixed, interlocked, and in good condition?
- Emergency Systems: Are E-stop buttons visible, accessible from all operator positions, and functioning correctly? Do they immediately and safely stop all hazardous motion?
- Energy Isolation (LOTO): Does the machine have a clear, single-point lockout/tagout capability for maintenance?
- Load Integrity: Are the machine's load capacity ratings clearly marked? Are mechanical locks, pins, or redundant safety systems in place to prevent a load from falling in case of hydraulic failure? This is non-negotiable.
- Hydraulic/Pneumatic Safety: Are hoses and fittings free from wear, abrasion, and leaks? Are pressure relief valves correctly set and functional?
- Ergonomics: This is a crucial, often overlooked area. Is the operator forced into awkward postures to load the machine or press controls? Is the control panel confusing? Poor ergonomics lead to fatigue, which leads to mistakes and injuries.
During my career, I've seen how simple ergonomic changes can have a huge impact. At a facility in Pennsylvania, operators had to reach awkwardly over a railing to use the tilter's controls. We proposed relocating the control pedestal to a more comfortable position. Not only did this reduce physical strain on the workers, but it also shaved a few seconds off the cycle time because the operator had a better line of sight and could move more efficiently.
Using a Risk Matrix
To move from observation to action, engineers often use a risk assessment matrix. This helps quantify the danger and prioritize what needs to be fixed first.
| Hazard Identified | Likelihood (1-5) | Severity (1-5) | Risk Score (L x S) | Action Required |
|---|---|---|---|---|
| No mechanical lock for tilted position | 2 (Unlikely) | 5 (Catastrophic) | 10 (High Risk) | Immediate Install of Safety Pin |
| Worn hydraulic hose | 4 (Likely) | 4 (Major) | 16 (Critical) | Immediate Replacement |
| Awkward control panel location | 5 (Certain) | 2 (Minor) | 10 (High Risk) | Relocate Control Pedestal |
| Missing warning labels | 5 (Certain) | 1 (Negligible) | 5 (Medium Risk) | Install New Labels |
This structured approach turns safety from a subjective feeling into an objective, manageable process. It protects employees and aligns directly with the goal of maintaining stable, reliable production.
How Do Maintenance Costs and Reliability Data Influence the Final Decision?
Your maintenance team seems to be working on the same old mold tilter every other week. A hydraulic leak one day, a faulty sensor the next. Each time it breaks down, production stops, and your schedule is thrown into chaos. It's easy to see these as small, individual problems. But a U.S. engineer evaluating the system sees a pattern. They know that the true cost of a machine isn't its purchase price, but its Total Cost of Ownership (TCO). The constant "firefighting" by your maintenance crew is a massive hidden cost that kills both your budget and your plant's overall efficiency.
U.S. engineers heavily rely on maintenance logs and reliability data to calculate a machine's Total Cost of Ownership (TCO). They analyze metrics like Mean Time Between Failures (MTBF) and Mean Time To Repair (MTTR) to quantify the real-world cost of unreliability. This data-driven TCO analysis often reveals that a new, more reliable machine is cheaper in the long run than continuing to patch up an old one.

Moving Beyond the Purchase Price
The decision to invest in new equipment becomes clear when you look at the whole financial picture. The initial capital expense is just one piece of the puzzle. A thorough evaluation must include all the costs associated with keeping that machine running.
Key Metrics for Reliability Analysis
- Mean Time Between Failures (MTBF): This is the average time the machine operates successfully between breakdowns. A low MTBF means the machine is unreliable and frequently disrupts production.
- Mean Time To Repair (MTTR): This is the average time it takes to get the machine running again after it fails. A high MTTR can indicate a complex design, poor access for maintenance, or difficulty in getting spare parts.
- Cost of Downtime: This is the most critical number. How much money do you lose for every hour the machine is down? This includes lost production value, idle labor costs, and potential late shipment penalties.
- Maintenance Costs: This includes the cost of spare parts and the labor hours spent on both scheduled preventive maintenance and unscheduled emergency repairs.
I once consulted for a company whose owner was proud of how long he'd kept his old equipment running. But his maintenance logs told a different story. His 20-year-old tilter had an MTBF of just 40 operating hours. It broke down almost weekly. His team's MTTR was high because they had to special order parts. When we calculated his cost of downtime at $2,000 per hour and factored in the maintenance expenses, the "free" machine was actually costing him over $100,000 a year.
The Power of a TCO Calculation
A TCO analysis puts all these numbers into a simple comparison. It allows for an apples-to-apples evaluation of keeping the old system versus buying a new one.
| Cost Component | Old System (Annual Cost) | New System (Annual Cost) |
|---|---|---|
| Spare Parts & Labor | $25,000 | $2,000 (Warranty) |
| Downtime Cost (based on MTBF) | $100,000 | $5,000 |
| Energy Cost | $5,256 | $876 |
| Total Annual Operating Cost | $130,256 | $7,876 |
| Return on Investment (ROI) | N/A | Payback in < 1 Year |
(Assuming new machine cost of $120,000)
When presented this way, the decision becomes obvious. The new machine pays for itself in less than a year. This is how engineers justify major capital expenditures. They don't talk about features; they talk about reliability, uptime, and return on investment. This directly addresses the core goals of any plant owner: increasing capacity utilization and improving the bottom line.
My Insights: Beyond the Metrics, What Is the Real Differentiator?
You've done the work. You have the spreadsheets. You've analyzed the cycle time, calculated the energy savings, audited for safety, and projected the maintenance costs. On paper, two or three different systems from different suppliers might look very similar. They all meet the basic requirements. So, how do you make the final choice? If you rely only on the numbers, you might miss the single most important factor that determines the long-term success of your investment. This can lead to a decision you regret years down the road when you need support and can't get it. After my journey from being an engineer on the factory floor to building my own successful machinery company, SHJLPACK, I've learned what the most experienced U.S. engineers look for when the numbers are close.
Beyond the technical specifications and cost analysis, the real differentiator that top U.S. engineers seek is the quality and depth of the supplier as a strategic partner. They evaluate the supplier’s ability to provide comprehensive support through the entire lifecycle of the equipment, from customized design and seamless integration to responsive after-sales service and a clear path for future upgrades.
The Search for a True Partner
When I started my own factory, I wasn't just buying machines. I was building relationships. I needed suppliers who understood my vision, who could help me solve problems I hadn't even thought of yet. Men like Javier, who have built their own companies from the ground up, understand this deeply. You are not just buying a piece of steel; you are investing in a capability for your business. The best U.S. engineers I've worked with embody this mindset. They ask questions that go far beyond the quote.
Questions that Uncover a True Partner
- "How will you support the integration of this system with our existing MES and control architecture?" This shows they are thinking about digitalization and data, not just mechanical function.
- "What is your standard procedure for remote diagnostics and support?" They want to know how quickly you can help them solve a problem to minimize downtime.
- "Can you show me examples of how you have customized this system for a challenge similar to ours?" They are testing your engineering depth and problem-solving skills, not just your sales pitch.
- "What is your long-term plan for spare parts availability?" This is about future-proofing their investment and avoiding the exact obsolescence problem they are trying to solve now.
- "What training do you provide for our maintenance and operations teams?" A great machine is useless if your team can't operate and maintain it effectively. A partner invests in your people's success.
This is the core of our mission at SHJLPACK. We built our company not just to sell machines, but to be that strategic partner. We share our knowledge because we believe an educated client is the best client. We succeed when you succeed.
Evaluating the Partnership Potential
| Supplier Quality | Supplier A (Commodity) | Supplier B (Partner) |
|---|---|---|
| Customization Ability | Standard models only | Fully customized |
| Integration Support | API docs provided | On-site engineers |
| After-Sales Service | Email support ticket | Dedicated tech + remote access |
| Proactive Advice | None | Recommends future upgrades |
| Partnership Value | Low | High |
The final decision often comes down to this: Who do you trust to be there for you in five years when you need a critical part or want to upgrade the system to meet a new environmental regulation? The numbers on the spreadsheet are critical for getting you to the final round, but trust in the partnership is what wins the deal.
Conclusion
Evaluating a mold tilting system effectively is a blend of science and strategic insight. U.S. engineers combine hard data on performance and cost with a deep evaluation of the supplier's partnership potential.


